
The dashboard is your at-a-glance view of the last 90 days. Open it from Home in the left-hand navigation.
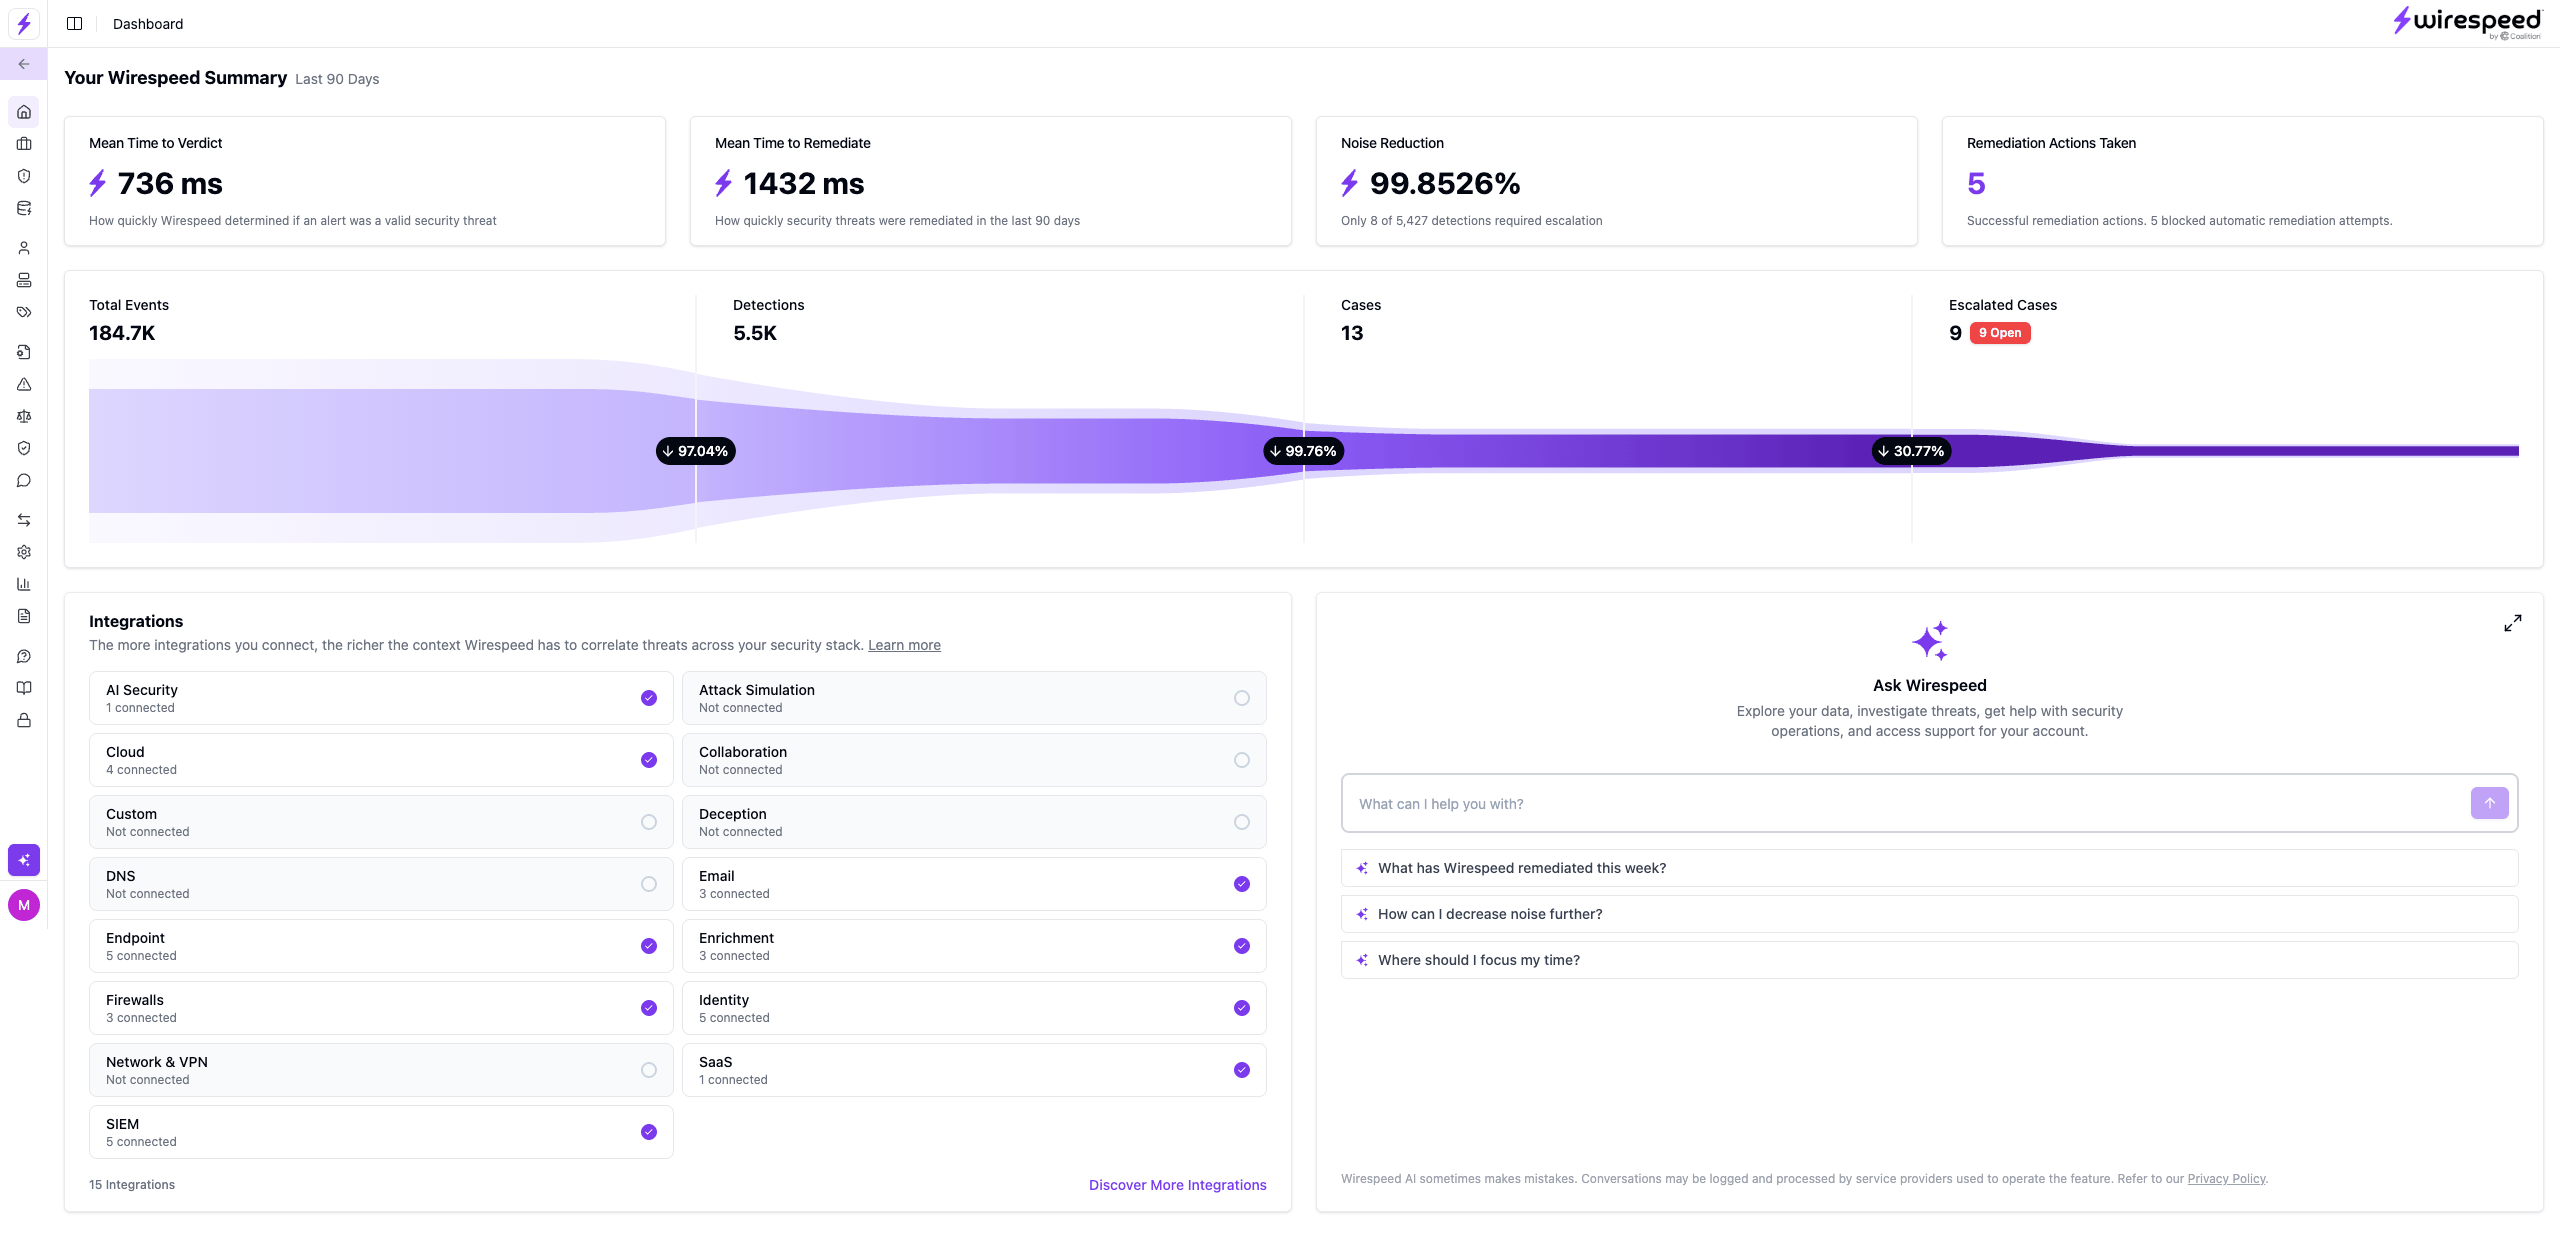
The Wirespeed dashboard, with the 90-day summary, the events-to-cases funnel, connected integrations, and Ask Wirespeed

What you see

  • Mean time to verdict is how quickly Wirespeed decided whether an alert was a real threat.
  • Mean time to remediate is how quickly those threats were remediated.
  • Noise reduction is the percentage of detections that did not need escalation.
  • Remediation actions taken counts successful containment actions. It also shows how many automatic attempts were blocked.
The chart under those numbers shows how that volume drops over the same period: from every event Wirespeed ingested, to detections, to cases, to the cases that were escalated.

Integrations

The integrations list shows which kinds of tools are connected. The more you connect, the more context Wirespeed has to correlate threats. Add more from Integrations.

Ask Wirespeed

The panel on the dashboard answers questions about this summary in plain language. You can also open Ask Wirespeed from the bottom of the left-hand navigation. See Ask Wirespeed AI.